本日12月13日を1213と4ケタの数で表すと、1213は素数です。西暦を含めた20161213は、73×276181と素因数分解できるので素数ではありません。
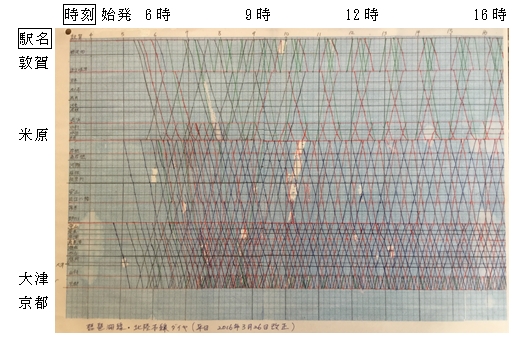
今回は、2016年度3年生の中嶋菊之くんが自由研究で作成したJR北陸本線と琵琶湖線(東海道本線)、敦賀(つるが)から京都までのダイヤグラムを紹介します。ダイヤグラムとは、時刻表をグラフで表したものです。
縦軸は距離(駅名)、横軸は時間です。普通、快速、新快速、特急の4種別の列車を、それぞれ黒、青、赤、緑と区別しています。始発から終電までの全旅客列車のスケジュールが入っていて、駅での停車時間もわかります。昔は、ダイヤグラム専門の職人(「スジ屋」と呼ばれているそうです。映画「交渉人 真下正義」では「線引き屋」という名前で登場していました。)が鉛筆とものさしを使い、知識と経験を駆使して書いていました。中嶋くんも「スジひき」と表現しています。今、ダイヤグラムはコンピュータを使って作成されています。
2年生で学習する「一次関数」の知識があれば、より深く楽しめます。
<中嶋くんの作成したダイヤグラム>
誌面の関係で、半分(始発から16時台まで)を紹介します。

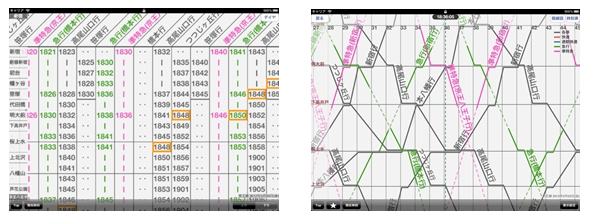
<参考>
京王線「新宿-八王子」間の時刻表(左)とダイヤグラム(右)

“Diagram”
This graph is a “Diagram”, which shows the time table of the JR Hokuriku line and Biwako line (Tokaido line) from Tsuruga station to Kyoto station, made by Nakajima Kikuyuki san. He is in the 9th grade in 2016.
The vertical axis shows the distance between stations. And the horizontal axis shows the time. Local trains are indicated by black lines, rapid trains are blue, special rapid trains are red and limited expresses are green. It shows all the passenger trains for a day. You can also see how long trains will stop at the station.
In the past, there were professional craftsmen, who wrote it using pencils and straight edges. He also wrote it by pen. But now it is written by computers.
If you have studied “Linear function”, you will be able to enjoy this diagram much more.


